Chembricks Benchmarks
Benchmarking our models on chemistry picked to be hard
In our launch post we promised to publish benchmarks of our own models, with error bars and stated limits, and to hold ourselves to them in public. This is the first installment. It covers four production cmbx_ models plus one small extra, scored on tens of thousands of molecules, with every point plotted and the failure tails left in. A model you cannot see fail is a model you cannot trust.
A test set built to be hard
Most public quantum chemistry benchmarks are friendly. QM9, the field's workhorse, contains molecules with at most nine heavy atoms, drawn from just five elements (C, H, N, O, F), at equilibrium geometries. Scoring well on it says little about the molecules a chemist actually brings to work.
So we built our own test set and made it hard on purpose. Starting from about 119 million molecules across four screening libraries (MERCK, PubChem3D, ChemBridge, Enamine), we selected a benchmark of roughly 100,000 molecules with two deliberate biases. First, hard chemistry is prioritized: up to half of every size stratum is filled with molecules carrying features that ML models are known to struggle with, including cage scaffolds (cubane, bicyclo[1.1.1]pentane, norbornane, adamantane), strained three and four membered rings (cyclopropanes, epoxides, aziridines, oxetanes and their sulfur cousins), spiro centers, bridged bicyclics, polyhalogenated molecules, and rare heteroatoms (P, B, Si, Se, Te, As). Second, diversity is enforced: within each stratum, molecules are deduplicated by Bemis-Murcko scaffold (via RDKit), so the set cannot be dominated by one lucky chemical family. The selection pipeline is deterministic: rerunning it with the same seed reproduces the identical benchmark file.
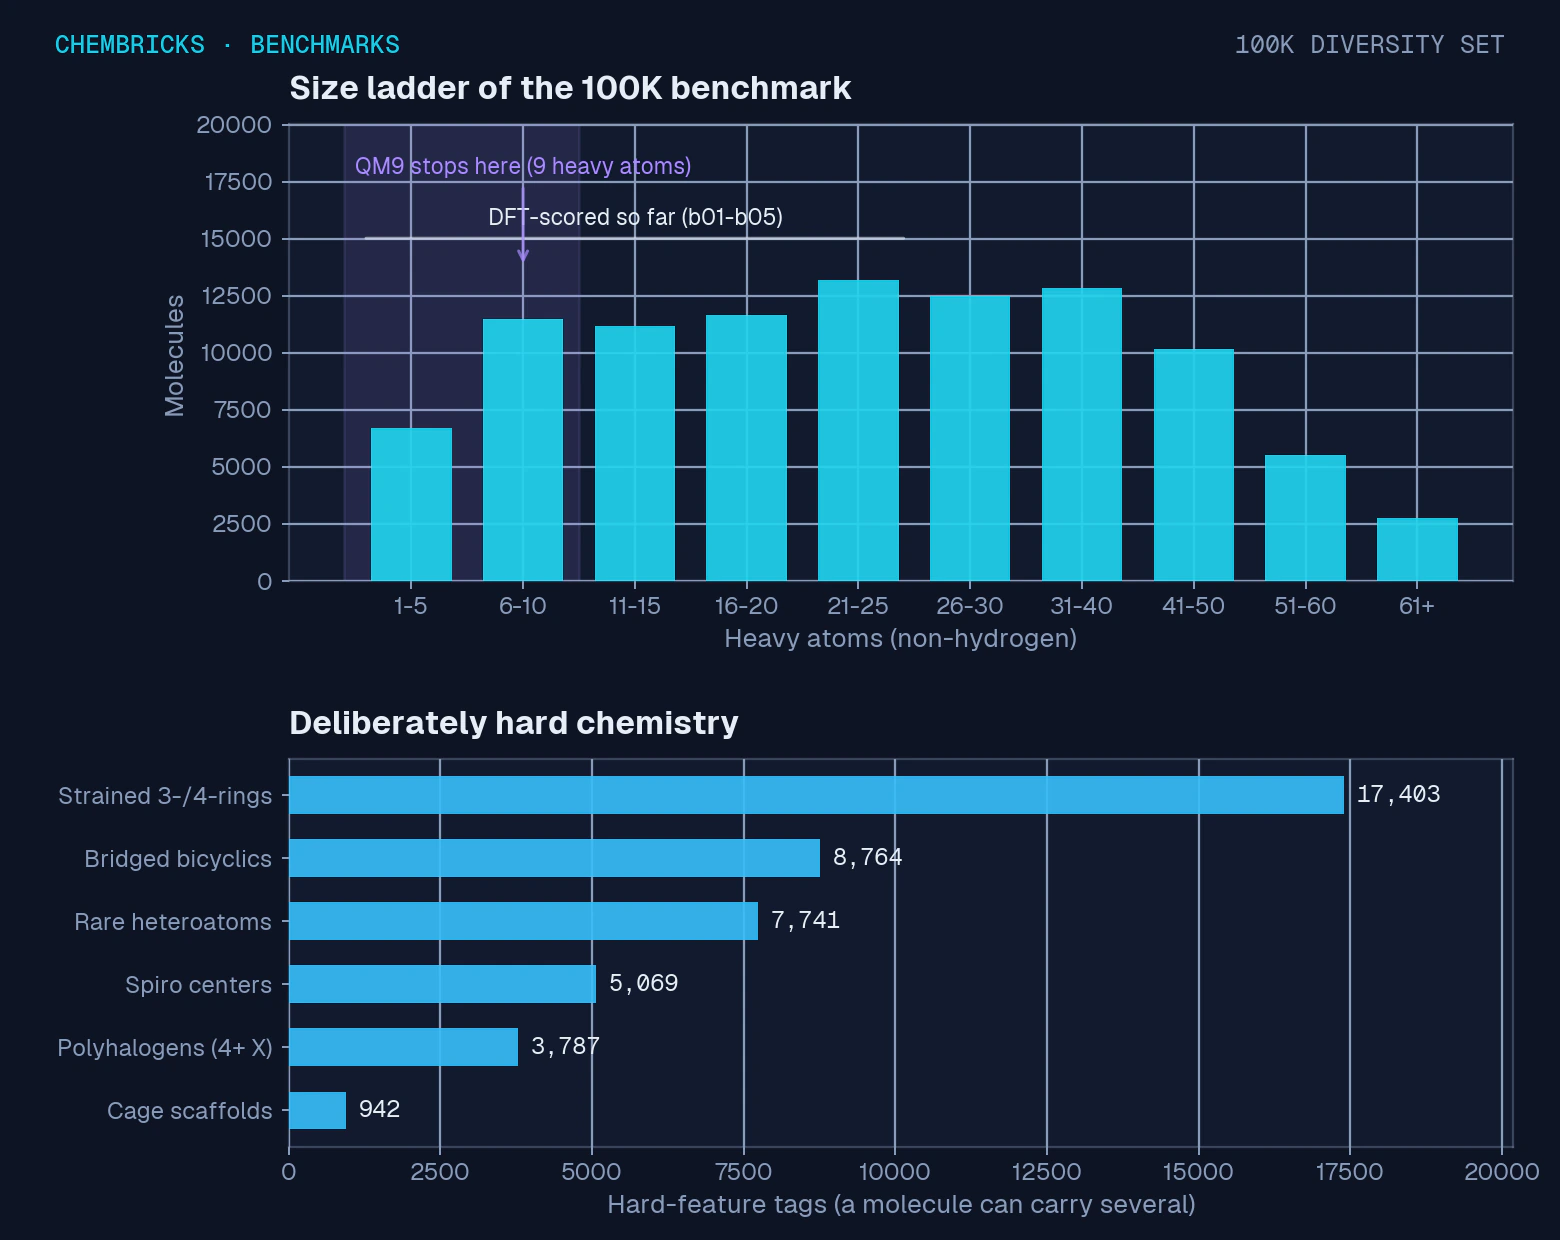
The DFT reference computation walks up this ladder in batches. The results below use the first five batches, b01 to b05: 49,992 unique molecules from 1 to 25 heavy atoms, averaging 13.3.
| Batch | Molecules | Avg heavy atoms | Range | Median |
|---|---|---|---|---|
| b01 | 10,000 | 5.3 | 1 to 7 | 6 |
| b02 | 10,000 | 9.7 | 7 to 11 | 10 |
| b03 | 10,000 | 13.4 | 11 to 16 | 13 |
| b04 | 10,000 | 17.0 | 16 to 21 | 16 |
| b05 | 9,992 | 21.2 | 21 to 25 | 21 |
| All | 49,992 | 13.3 | 1 to 25 |
The ladder benchmark, batches b01 to b05: wB97M-V DFT single points (PySCF) on g-xTB geometries, all unique structures.
What the models predict, and what they are scored against
A quick tour of the quantities on the line, in plain language:
- Atomization energy is the energy holding a molecule together relative to its isolated atoms; getting it right means the model understands bonding. One wrinkle we found while preparing this post: the dashboard's atomization values are measured against fixed per element reference constants that do not coincide with true isolated atom energies (methane, for example, reads about 476 kcal/mol where the textbook electronic value is near 420). A constant per element cancels in every error metric, so no accuracy number is affected, but it is why every energy parity below is plotted relative to a per element baseline instead of on raw axes.
- Internal energy here means the molecule's total electronic energy at its geometry. Raw values grow with molecule size into the millions of kcal/mol, so where we plot them we subtract a fixed per element baseline to make the errors visible.
- Solvation free energy is the free energy change when a molecule moves from the gas phase into solution at room temperature. It is a main driver of how happily a compound dissolves.
- logP, the octanol/water partition coefficient, follows from a thermodynamic cycle over the solvation energies in both solvents. It is the standard measure of how greasy or water loving a molecule is.
- Ionization potential and electron affinity are the energies to remove or attach an electron; they govern redox behaviour.
Each model is scored against the quantum chemistry method it was trained to reproduce. As in the launch post: near-DFT means a model reproduces its trained reference method, and agreement with experiment can be no better in expectation than the reference method itself.
cmbx_internal_energy_v2andcmbx_organic_electronic_v2dlare scored against wB97M-V single points (PySCF) on g-xTB geometries, in vacuum, on the ladder benchmark above.cmbx_solvation_logp_v2is scored against M06-2X/cc-pVDZ in vacuum plus SMD in water and 1-octanol, each with geometry optimization, on the Koutroumpa experimental logP dataset (roughly 12,500 molecules with measured logP values).cmbx_organic_smd_v2is scored against wB97X/cc-pVDZ with SMD water, on a reserved test set of metal free organic ligand molecules (15 to 29 heavy atoms) from our copper/nickel binding program.
One honest detail: every molecule can be scored in two modes. In coords mode the model is evaluated on the reference geometry; in SMILES mode the model starts from the molecular graph alone and generates its own geometry first, which is the harder, more realistic setting. Below, cmbx_internal_energy_v2 and cmbx_organic_smd_v2 are quoted in coords mode; cmbx_solvation_logp_v2 and cmbx_organic_electronic_v2dl are quoted in SMILES mode. Each plot states its n.
Trained on bricks, tested on molecules
The training side is the principle we are named for. Rather than training on molecules like the ones in the test set, the cmbx_ models learn from compact libraries of small fragment bricks: local atomic environments whose behaviour recurs across organic chemistry. The solvation model, for example, is trained on roughly 236,000 such fragments, then evaluated on real drug-like molecules, most far larger than any training fragment. An applicability check travels with every prediction: it warns when a molecule sits far from the training fragments. The decomposition method is patent pending, so this post describes the principle, not the recipe; what the benchmark shows is whether the transfer actually works.
The numbers
The table below is our current dashboard accuracy report, one headline number per model: the mean absolute error, or MAE. The parity plots then add the median error (MedAE), which is what a typical molecule sees, and RMSE, which the worst cases dominate. When MAE sits far above MedAE, a tail of hard molecules is dragging the average, and the plots show exactly where. For rough anchors: 1 kcal/mol is the traditional bar for chemical accuracy in thermochemistry, and logP within 0.5 to 1 log unit is the territory of good empirical estimators.
| Model | Headline quantity | n | MAE |
|---|---|---|---|
cmbx_internal_energy_v2 | Atomization energy, vacuum (kcal/mol) | 47,393 | 5.10 |
cmbx_organic_smd_v2 | Internal energy in water (kcal/mol) | 8,638 | 5.22 |
cmbx_solvation_logp_v2 | Octanol/water logP | 11,468 | 0.55 |
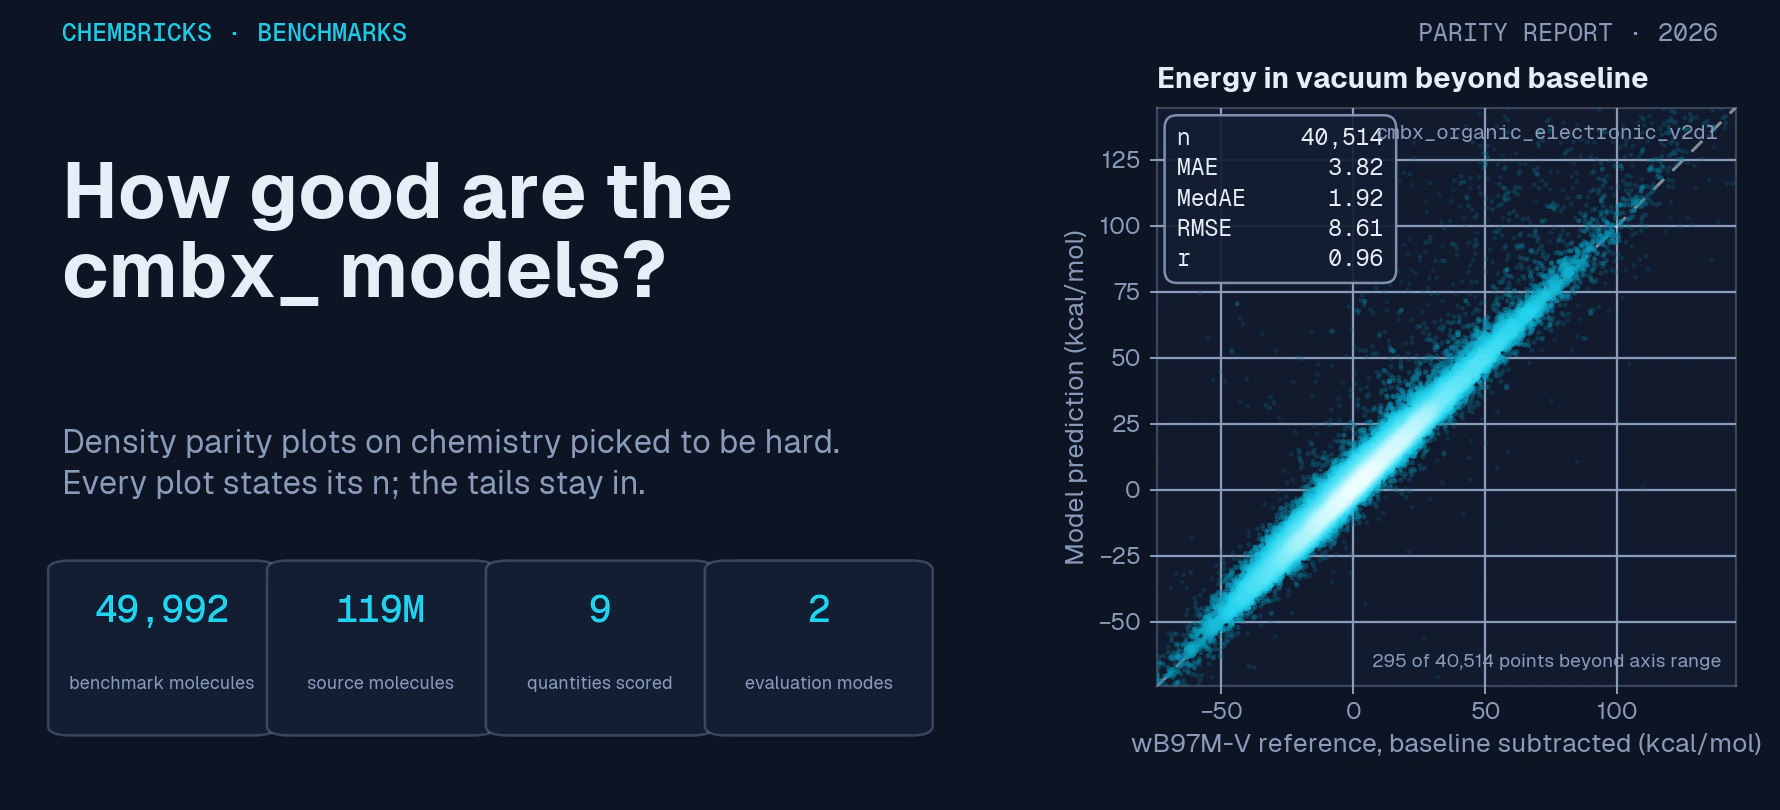
cmbx_organic_electronic_v2dl | Atomization energy, vacuum (kcal/mol) | 40,514 | 3.82 |
One headline quantity per model (its lowest error result); n is the size of the scored subset. MAE is rounded to two decimals and agrees with the recomputed plot statistics to within rounding. Each plot below adds MedAE and RMSE. The solvation model also predicts water and octanol solvation free energies, shown in its figure. Dashboard model names: internal-energy-organic-v2, organic-smd-v2, smd-logP-v2, organic-electronic-v2dl.
Two disclosures before the plots. First, not every ladder molecule appears in every scored set: the current dashboard export covers 47,393 of the 49,992 ladder molecules for the direct energy model and 40,514 for the delta-ML model, and we have not yet published a per molecule accounting of that gap. Until we do, read the headline numbers as covering the scored subsets. Second, how to read the plots: the x axis is the reference value, the y axis is the model prediction, the dashed diagonal is perfect agreement, brightness shows how many molecules pile up on a logarithmic color scale, and a violet band, where shown, spans one median error around the diagonal. Points outside a plot's axis range are cropped from the picture only; every statistic includes them. All energy parities are shown relative to a per element baseline: raw energy axes grow with molecule size and depend on the choice of atomic reference constants, and the subtraction cancels both without touching a single error metric.
Atomization energy in vacuum: cmbx_internal_energy_v2
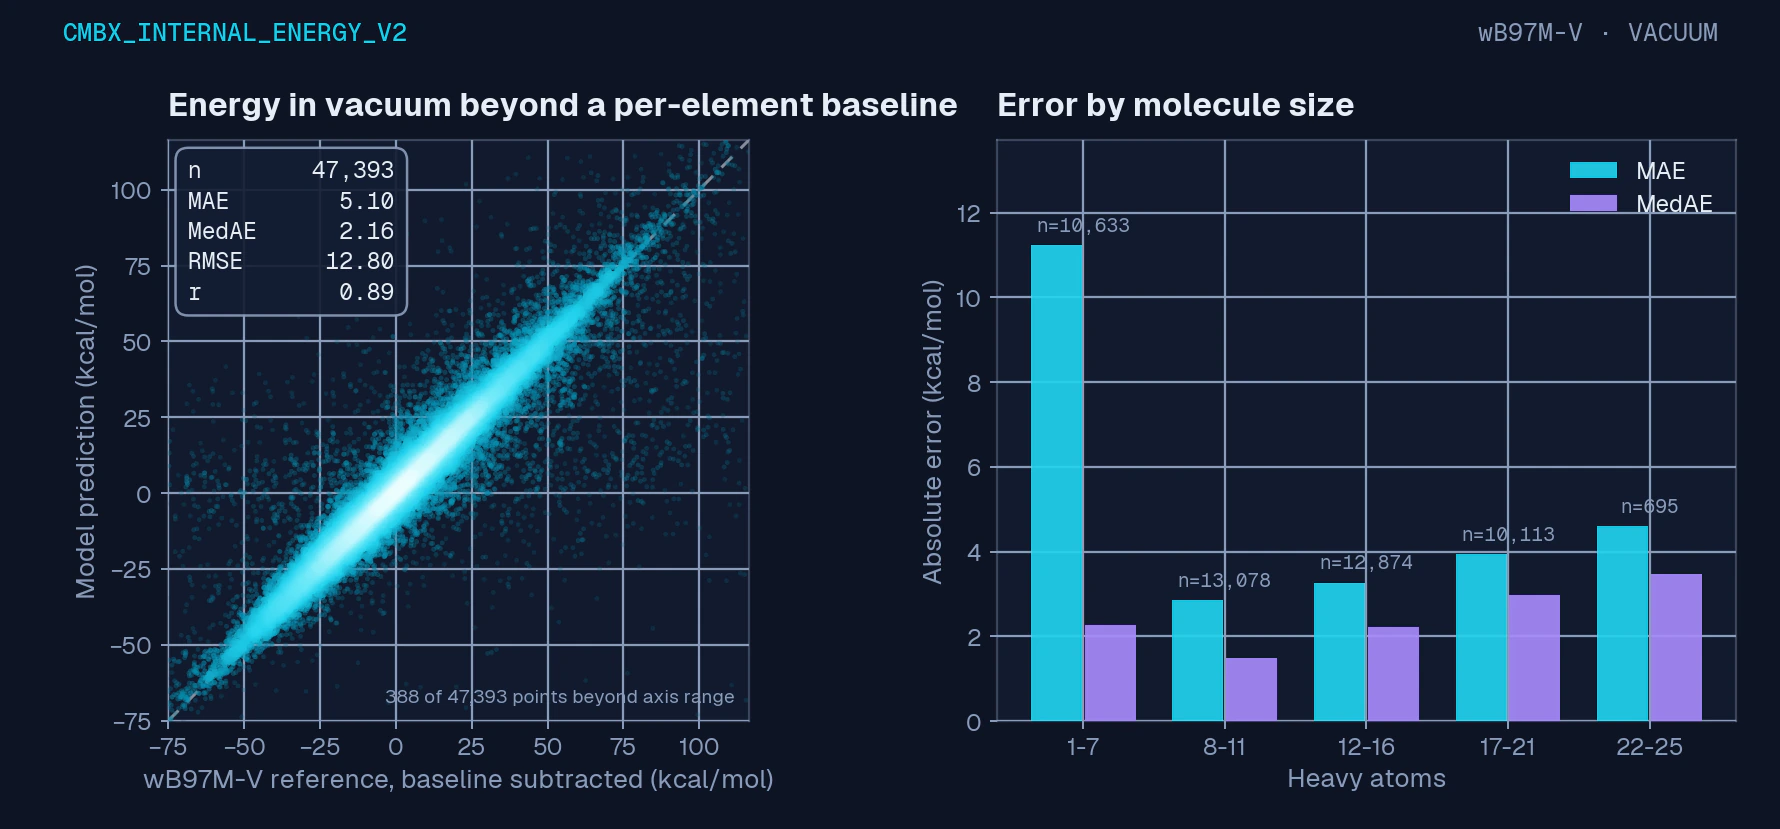
The typical molecule lands within 2.2 kcal/mol of the wB97M-V reference. The mean is pulled up to about 5 kcal/mol by a tail, and the size breakdown shows where that tail lives: the smallest bin, 1 to 7 heavy atoms, has a mean error of over 11 kcal/mol. That bin is where the benchmark's exotic fragments concentrate, tiny strained and unusual species with nothing nearby in training. From 8 heavy atoms upward the mean sits between roughly 3 and 5 kcal/mol and, more importantly, the median error grows only gently with size, from 1.5 to 3.5 kcal/mol across the ladder. That is the bricks transfer claim in data: what the model has learned locally carries to bigger molecules.
Energies in water: cmbx_organic_smd_v2
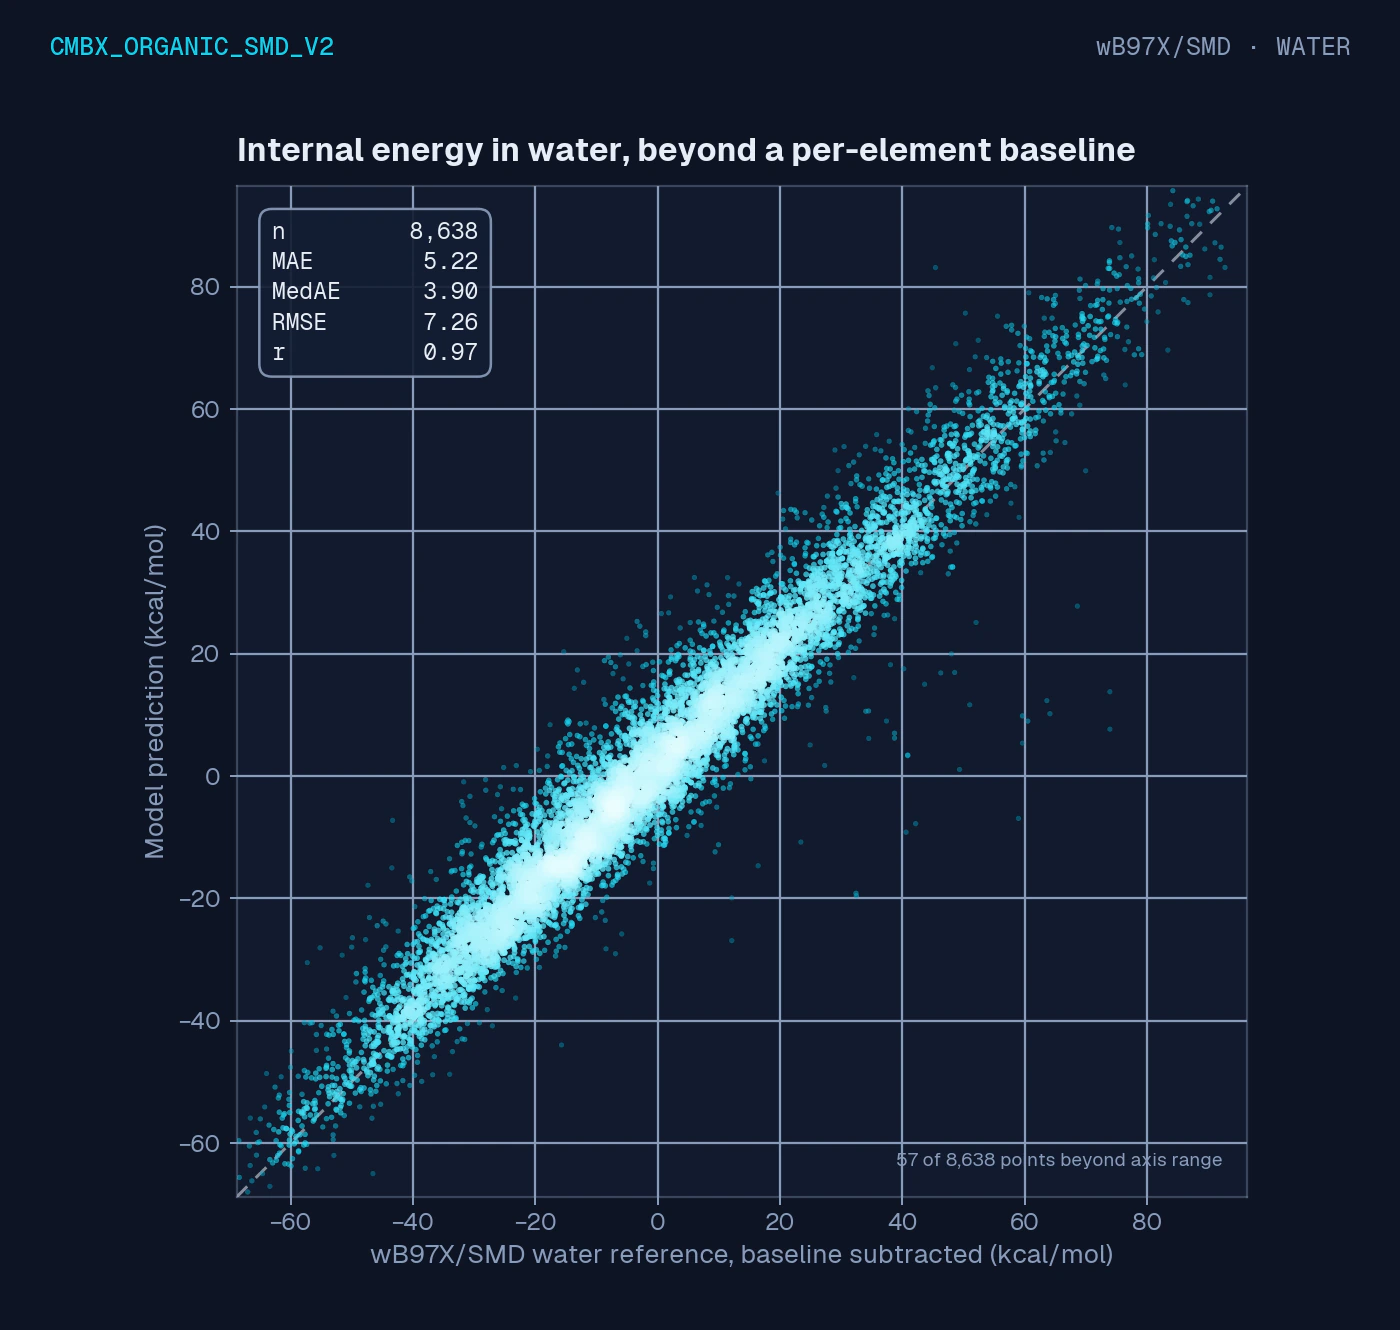
This model predicts the internal energy of organic molecules in water at the wB97X/SMD level, and it is scored only on larger molecules, 15 to 29 heavy atoms. The MedAE of 3.9 kcal/mol against an RMSE of 7.3 means typical and worst cases sit relatively close together here; the chemical domain is narrower than the ladder benchmark, so the two are not directly comparable.
The data family behind this model comes from our collaboration with Intel: within that program we generated DFT references for roughly 1.2 million organic molecules in water alongside more than a million metal complexes, computed on Intel Xeon processor systems. Intel's solution brief tells that story at headline level, with accuracy quoted as a single number. This page is meant as the rigorous companion. One methodological note matters here: total energies grow with molecule size into the millions of kcal/mol, so a raw total energy parity plot rewards any model with a perfect looking diagonal. The plot below subtracts the same per-element baseline from both axes first, an atomization style view that leaves every error metric unchanged and makes the correlation mean something.
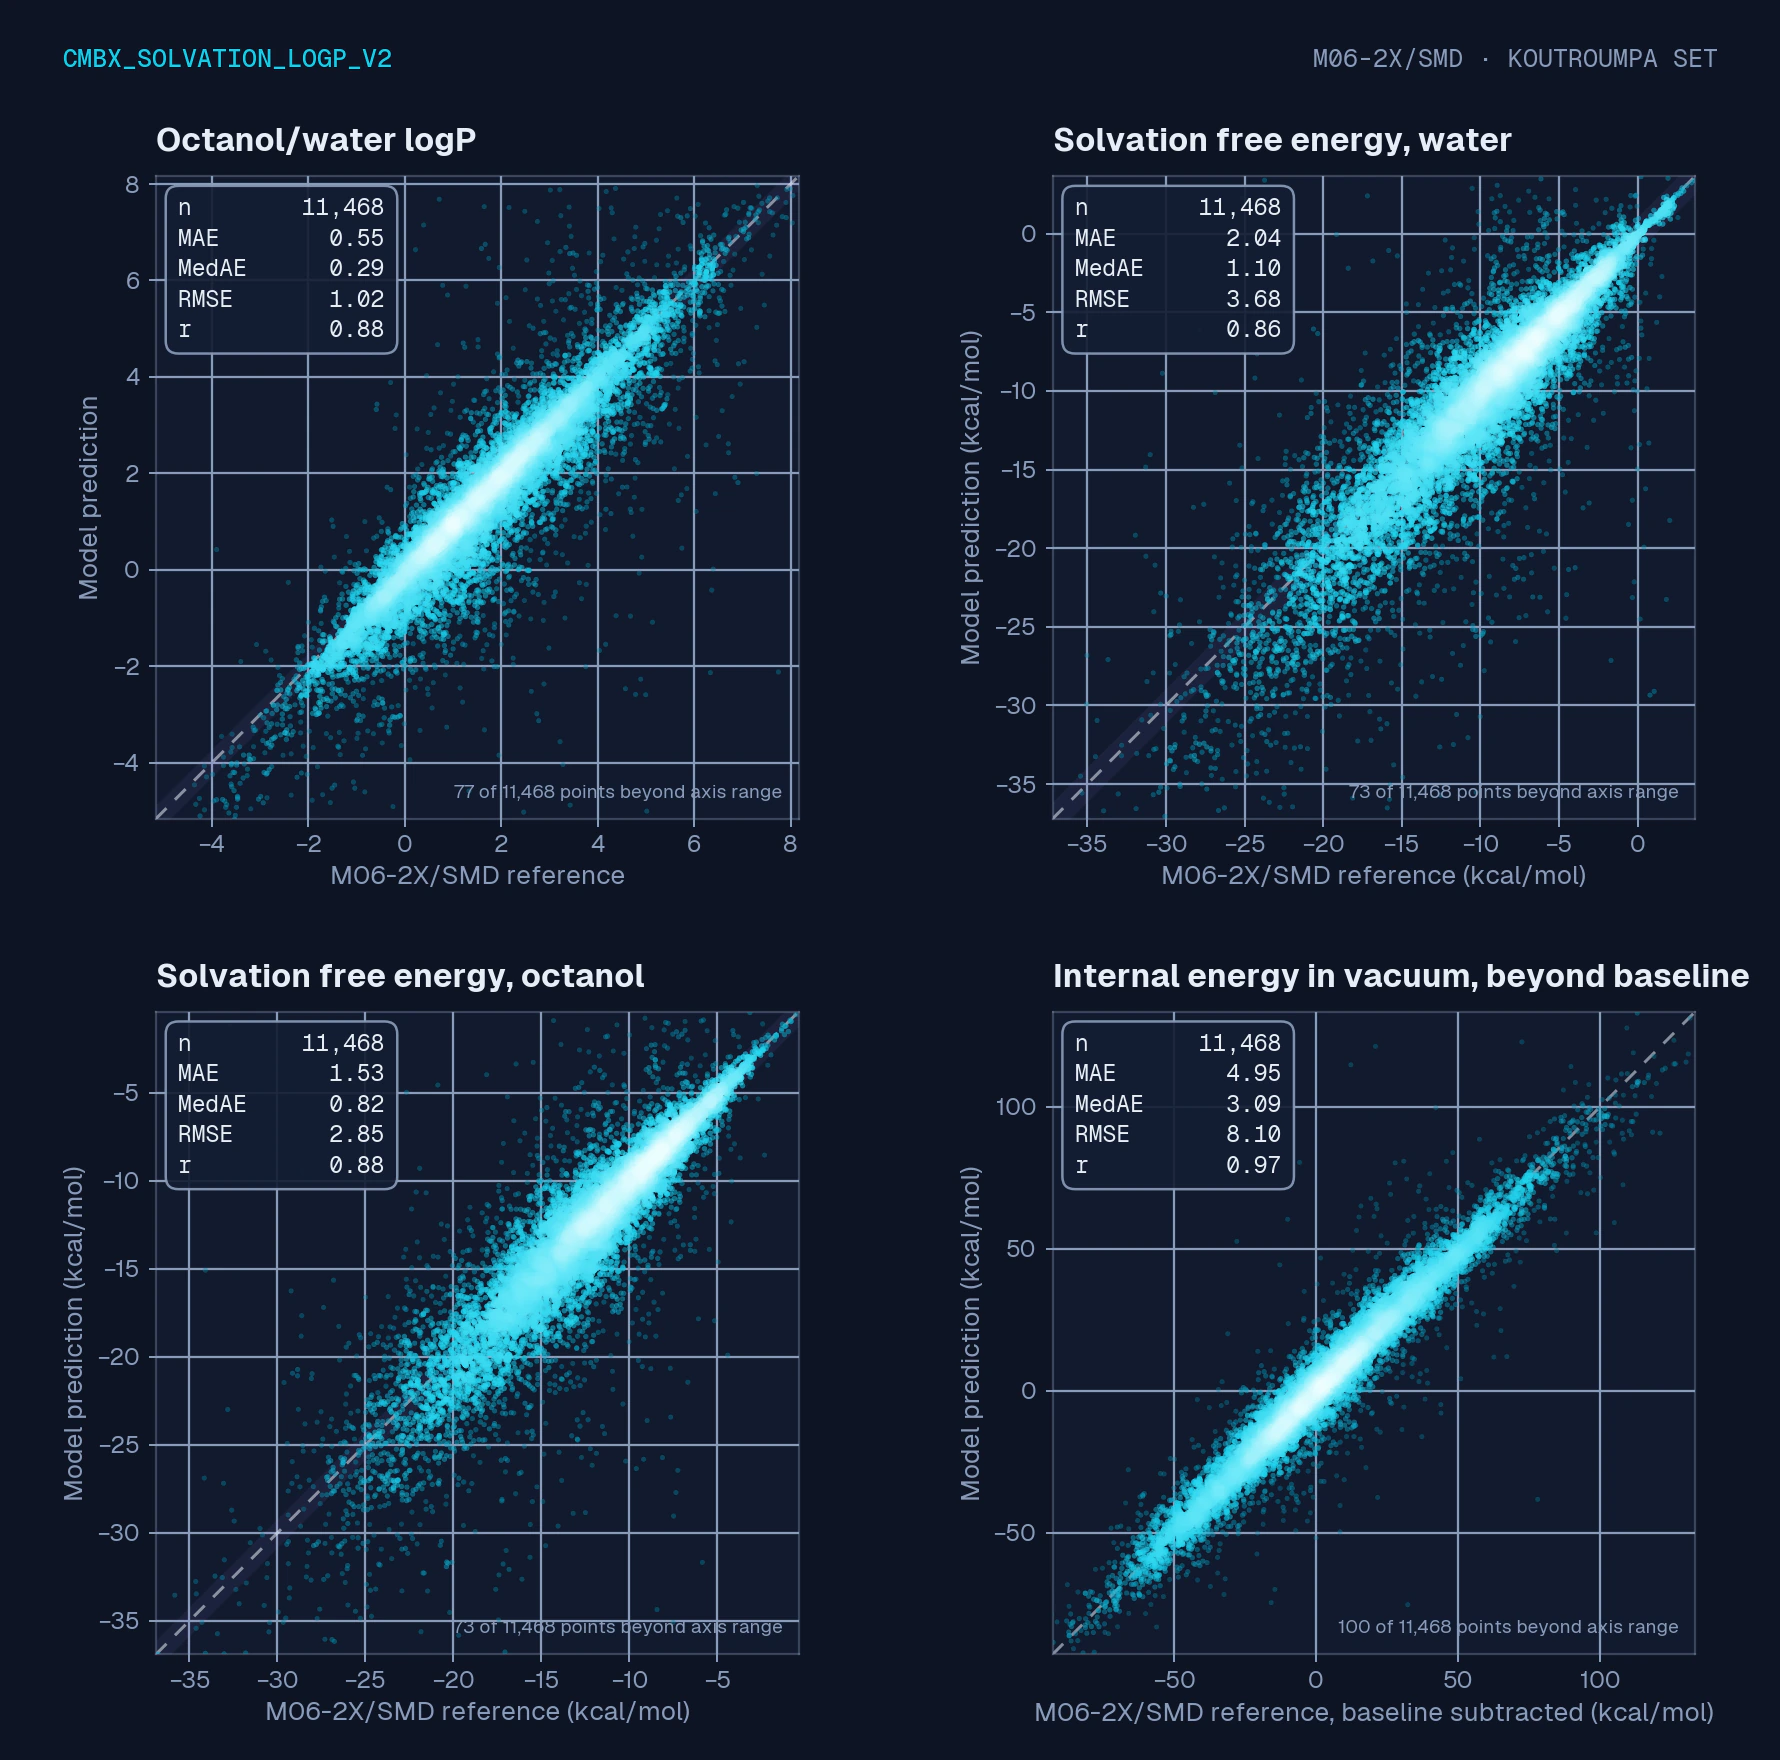
Solvation and logP: cmbx_solvation_logp_v2
Scored on roughly 11,500 molecules of the Koutroumpa logP dataset, from SMILES alone. The solvation energies land within about 1 kcal/mol for the typical molecule (MedAE 1.10 in water, 0.82 in octanol), and the derived logP has an MAE of 0.55 log units against the M06-2X/SMD reference cycle.
Being precise about what that 0.55 means: it is the error against the quantum chemistry reference the model was trained to reproduce, not against the lab. Comparing the same predictions directly with the measured values (11,426 molecules with matching experimental logP) gives an MAE of about 1.1, because the reference method's own solvation error enters as well and the two error sources combine. Both numbers are real; they answer different questions.
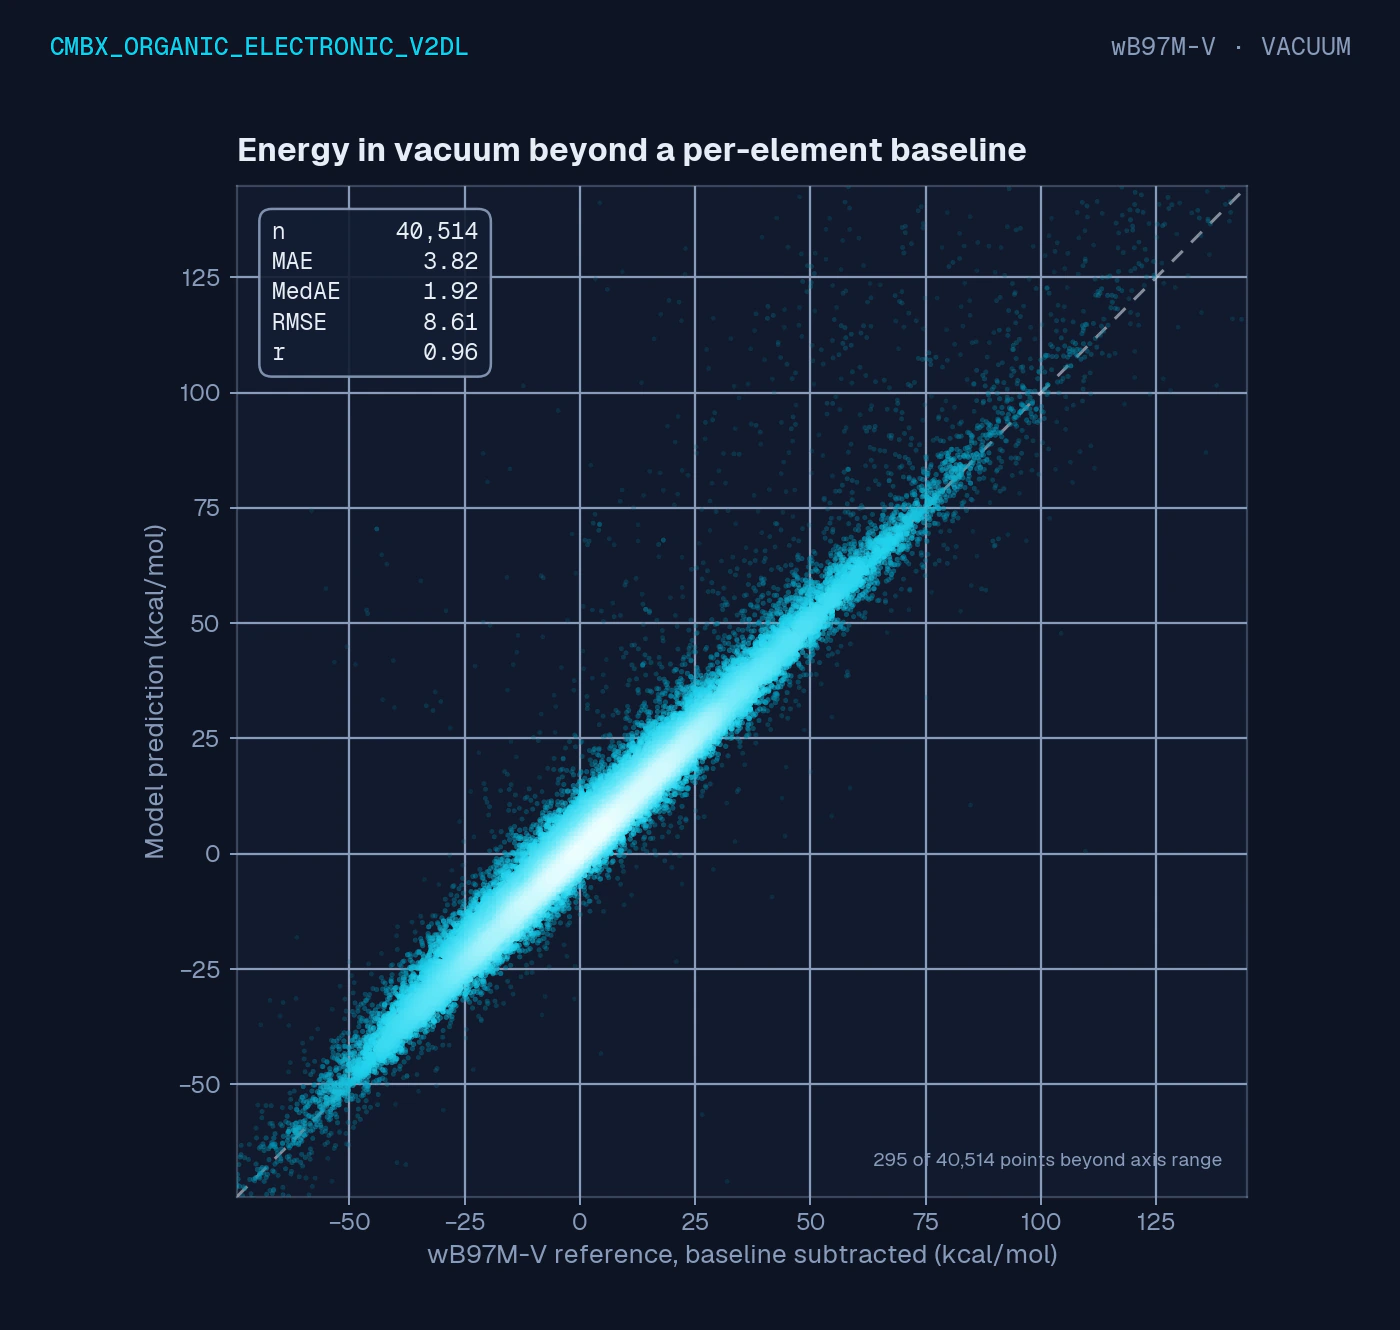
Delta-ML atomization: cmbx_organic_electronic_v2dl
This model takes a different route to the same ladder benchmark: it is a delta-ML correction, starting from a fast g-xTB calculation and learning only the difference to the wB97M-V reference. Working from SMILES alone, it reaches an atomization MedAE of 1.9 kcal/mol on its scored subset of 40,514 molecules, with the same pattern of a small hard tail. The direct model and this one are scored on different subsets in different modes, so we resist ranking them against each other.
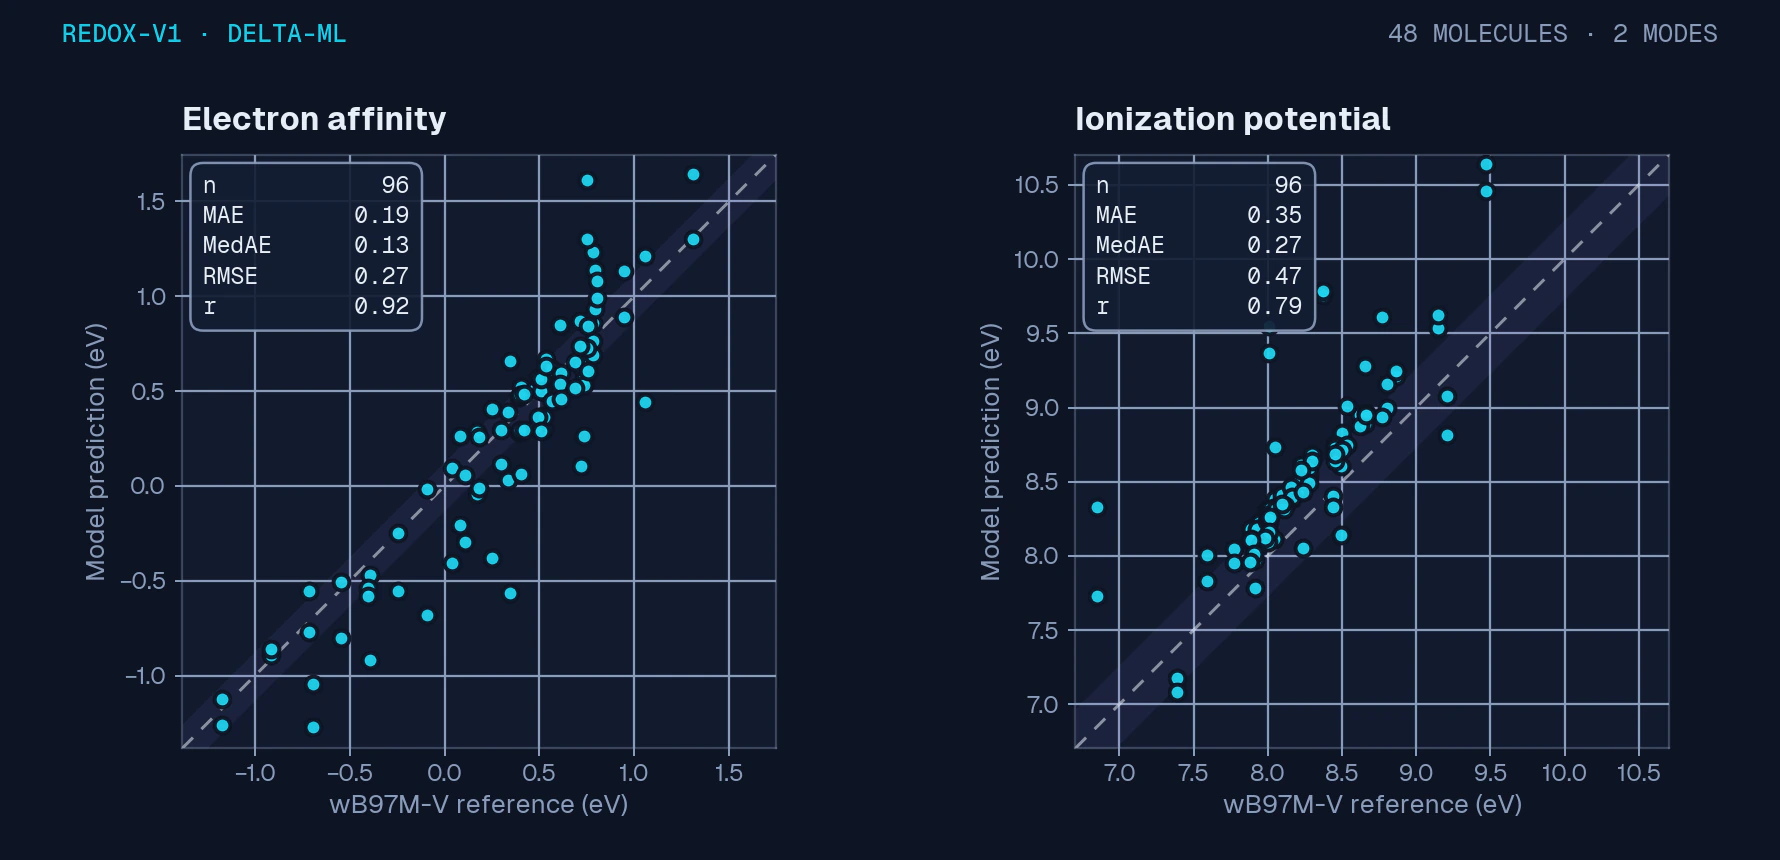
A small extra: redox on 48 molecules
For completeness, the cmbx_redox prototype (redox-v1), a delta-ML correction from a g-xTB baseline to wB97M-V for ionization potential and electron affinity. Treat this one as a smoke test, not a benchmark: 48 molecules scored in both evaluation modes gives 96 plotted points, and pooling the two modes overstates the independent sample, which is strictly 48. On that small set, electron affinity lands at MAE 0.19 eV and ionization potential at 0.35 eV, with a visible overprediction at the low end of the IP range.
The same accuracy, in minutes not a year
Accuracy is only half the reason these models exist; the other half is speed. Reproducing the wB97M-V reference for the roughly 50,000 molecule ladder is what the cmbx_ models do in minutes on a single CPU thread. Computing those same DFT single points directly, on that same single thread and with no GPU, would take on the order of a year of continuous compute.
That year is an estimate, not a measured benchmark: we scaled a typical single core hybrid DFT single point, roughly ten minutes for a drug fragment sized molecule, across the real size distribution of the test set, which puts the reference near one core year (months to a few years depending on basis set and convergence) against minutes for the models. The resulting speedup, in the range of ten thousand to a hundred thousand times, is the same order of magnitude Intel reports in its solution brief (about one second versus twelve hours) from an independent run. Both comparisons are CPU to CPU: the point is not faster chips, it is that a trained surrogate replaces a calculation that is fundamentally expensive.
What these numbers do not say
A benchmark is only as honest as its caveats, so here are ours in one place:
- Errors are measured against the trained reference methods. The reference methods themselves carry error against experiment, which is why the logP number vs experiment is about double the number vs reference.
- The two evaluation modes differ: generating a geometry from SMILES costs accuracy compared with scoring on the reference geometry. We quoted each model in the mode our dashboard reports.
- Ladder coverage so far is batches b01 to b05, molecules up to 25 heavy atoms. The larger rungs of the 100K benchmark are being computed, and we will publish those numbers when they land, whatever they look like.
- The redox set is far too small to generalize from.
- The speed comparison is an order of magnitude estimate, not a measured wall time benchmark; the reference cost is scaled from a typical single core DFT single point and depends on basis set and convergence choices we did not hold fixed.
cmbx_organic_electronic_v2dlalso predicts frontier orbital levels. Those benchmarks are still being hardened and are not reported here; they will get their own installment.- The benchmark structures, per molecule predictions, and full computational settings (including basis sets and convergence details for the ladder references) are not yet public. Releasing them alongside the remaining ladder batches is the plan, and until then these results are our report, not yet an independently checkable artifact.
A floor, not a ceiling
One last thing to keep in perspective: these are the first generation of our production models. Better ones are already in training as you read this, and every future generation will face this same public benchmark, on the same deliberately hard chemistry. Expect these numbers to improve, and expect us to keep showing you where they still fall short.
Check us. The fastest way to probe these models is to run your own molecule and inspect the evidence ledger behind every number.
Screening and simulation results support decisions; they do not replace experimental, regulatory or safety validation. The benchmark suite grows from here, and the numbers stay public.
The Chembricks team
Get new articles by email
Notes on physics validation for AI chemistry, straight from the team. No spam.
Double opt-in. Unsubscribe anytime.